MiniTutorial
Debugging RTSS Applications Remotely in Visual Studio
This MiniTutorial shows how to debug an RTX64 application remotely from a Target system using the familiar Microsoft Visual Studio development environment on a Host system.
Sections in this Topic:
Target Setup
Setup of the Target system requires the following steps:
Install the Remote Debugger:
- Install the Visual Studio remote debugger tools onto the Target system. Follow the instructions available from Microsoft to determine which install you will need:
https://docs.microsoft.com/en-us/visualstudio/debugger/remote-debugging
Install the RTX64 Runtime:
- Install the RTX64 Runtime. See the Runtime Install Guide or this Installation Overview for complete instructions.
For remote debugging with Visual Studio to work, the RTX64 Remote Debugger tools must be installed on the target system, no matter what version of the Visual Studio remote debugger tools is installed. If this is not already present on your system, the Runtime installer will install it for you.
Configure Remote Debugging:
For launch:
- Configure the Visual Studio remote tools
For attach:
- Configure the Visual Studio remote tools
- Configure remote debugging through the Control Panel:
- Select Allow new remote debugging attach connections to this computer
- Set the IP address and Port number.
Start the Subsystem:
- Start the Subsystem through the RTX64 Control Panel. For instructions, see Configuring RTX64 with the Control Panel.
Copy/Paste Remote Debugging Files:
- Navigate to
C:\Program Files\IntervalZero\Common\RemoteTools.
- Copy these files:
RtBaseDm.dllRtBaseDmUtil.dll
- Navigate to
C:\Program Files\Microsoft Visual Studio (2019/2017/2015)\Common7\IDE\Remote Debugger\x64, and then paste the two files into that folder.
Host Setup
Create or open the project in Visual Studio:
- Launch one of the supported versions of Visual Studio and either create a new project. For more information on creating a new project, see Developing Applications and DLLs with Visual Studio.
In this example, we'll create an RTSS application called RtssRemoteApp.
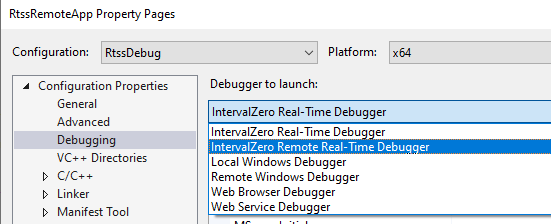
Configure the IntervalZero Remote Real-Time Debugger:
- With the project open in Visual Studio, select the IntervalZero Remote Real-Time Debugger from the Debugger drop-down.
- In the Property Pages dialog, click Configuration Properties > Debugging. Do the following:
- Make sure IntervalZero Remote Real-Time Debugger is selected.
- Set the Command line to the full local path to the binary you want to launch on the Target system. For example:
C:\Debug\RtssRemoteApp.rtss. - Specify any Command Arguments.
- Set the Remote Server Name to the name of the Target system.
NOTE: If the Remote Server Name you provide is invalid, the following error is encountered: The Microsoft Visual Studio Remote Debugging Monitor (MSVSMON.EXE) does not appear to be running on the remote computer. More appropriately, the Visual Studio Remote Debugger service on the target computer cannot connect back to this computer. The debugger is unable to resolve the specified computer name.
Debug the Target Application
IMPORTANT! The version of the Visual Studio Remote Tools installed on the Target system must exactly match the Visual Studio version on the Local system (the system running the debugger).
Start MSVSMON:
- On the Target system, launch the Visual Studio Remote Debugger from Start > All Programs > Visual Studio 2019/2017/2015.

- On the Host system, build the RtssDebug configuration of the binary you want to debug, and then copy that binary to the Command line path on the Target system that you specified in Step 2b under Host Setup.
- On the Host System, in Visual Studio, press F5 or Debug > Start Debugging to debug the binary on the Target system.
You should see the Host/Target connection in the Visual Studio Remote Debugging Monitor dialog.

Troubleshooting
If there are any problems connecting the host and target systems:
- Make sure the Visual Studio Remote Debugging Monitor (MSVSMON) is running on the Target system.
- Make sure the target system name in the RTX64 Host-Target Connection window matches the Computer Name found in the Configuration Properties > Debugging dialog on the Host system
- Make sure the application you want to debug has been copied to the Target path that you specified in the Configuration Properties > Debugging dialog on the Host System.
- If a firewall is in use on the Target System, you may need to configure it to allow certain ports for remote debugging.
- Antivirus software programs may cause problems with remote debugging. If you are unable to create a successful remote debugging session, check to see if Antivirus is installed on the Target System.
- The RTX64 Subsystem has been started on the target system
NOTE: Visual Studio may close and restart if the connection is lost during remote debugging.
